
The war in Ukraine started by the Russian leadership is changing all aspects of the Russian oil and gas business. The resulting sanctions are likely to include a partial embargo on oil and gas, probable price caps, and threats of secondary sanctions on anyone involved. More damaging will be long-term determination to avoid dealing with Russia. Oil and gas commitments are inherently a long-term relationship. Oil and gas production will decline, pulling down demand for oilfield services. REnergyCO strongly condemns the war and calls for an immediate withdrawal of Russian forces from Ukraine.
EU embargo on oil and price cap started 5th December 2022. Oil products will follow in February 2023.
The text below contains only a few data points to show the scope of the Russian Oil and Gas business. Please note that the graphs below are for illustration only and are not updated regularly.
Detailed data on some topics from listed below is available in the Russia Upstream and Oilfield Services 2021 report(click here to see details)
Crude and Condensate Production in Russia
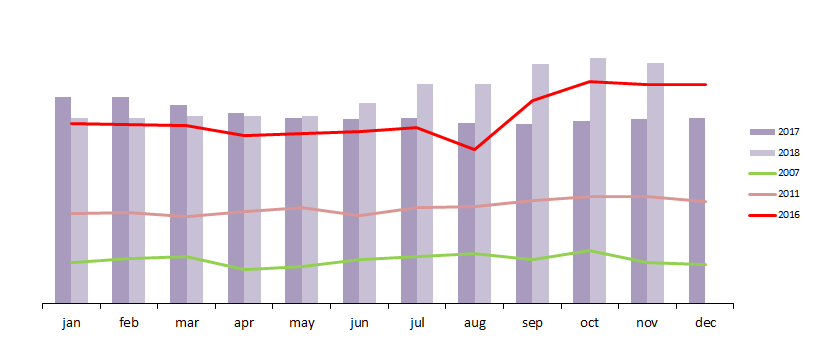
Russian crude oil and condensate production grew to almost 556 million tons (standard Russian accounting for oil/condensate production) in 2018. The OPEC+ deal in June was relaxed and Russia pushed production up in the following months of the year. Crude and condensate production was flat in 2017 at just below 547 million tons. Crude and condensate production in Russia grew 2.5% in 2016 to 547.5 million tons. The growth in September 2016 was delivered by new projects in YaNAD and continued growth in East Siberia.
Figure. Daily crude oil production in Russia in January 2007- September 2018 (thousand tons a day)
Natural and Associated Petroleum Gas Production in Russia
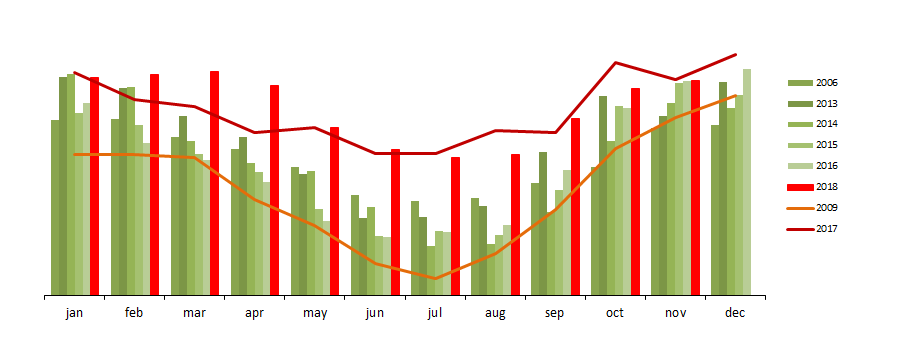
Natural and petroleum gas production grew to 741 bcm in 2018. In 2017 total production grew by 7.9%. The domestic market continued to be weak with all gains coming from record export to Europe.
Gas production was up 1% in 2016 to 652 bcm from 646 bcm in 2015 while Gazprom production remained almost flat.
Officials reported 1% decline in gas production in Russia in 2015 to 635 bcm from 640 bcm in 2014 (excluding flaring which is included in numbers in paragraphs below). This reported decline was very moderate considering lower production levels in the first nine months of the year, unusually warm weather in the last quarter, hectic supplies to Ukraine, and poor economic conditions of the Russian economy. This report suggested that Russian gas producers delivered in the 4th quarter 10 billion cubic meters more than in the 4th quarter 2014 – approximately the same volume as export losses to Europe in the 4th quarter of 2014 due to Gazprom’s restrictions on export in an effort to halt reverse supplies to Ukraine.
Figure. Gas production in Russia in January 2007 – September 2018 (mcm a day)
Russian Refinery throughput
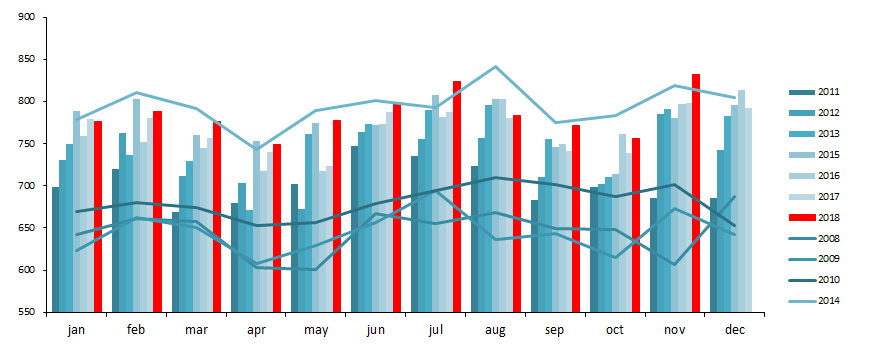
Russian refinery throughput grew to 287 million tons in 2018. Throughput remained almost flat in 2017 after it was down 1.1% in 2016 to 280 million tons.
In 2015, the refinery throughput in Russia declined for the first time since 2009 (-2.5%). The refinery throughput growth consistently exceeded crude and condensate production from 2005 (3.1% p.a. in 2005-2015 vs 1.2% p.a. for crude). The refinery throughput in Russia increased to 290 million tons in 2014 (up 5.3%). The growth rate in 2013 declined to 3% from an average 5% in 2010-2012. The refinery throughput grew 4% in 2012 to 268 million tons (5.36 mmbd).
Growth stalled in 2015, but there were no signs of major impact from the introduction of a so-called “Big Maneuver” (changes in export taxation of crude and petroleum products vs MET). Crude oil export duty freeze for 2016 at 2015 level (it was supposed to go down) reduces the potential impact of the “big maneuver” on refinery throughput in 2016.
If the first four months of 2016 were an indication of the future then a 5% decline in 2016 is possible (daily throughput was 4.2% lower than the first four months of 2015).
Figure. Refinery throughput in Russia in January 2008 – October 2018 (thousand tons a day in a month)
Liquefied Petroleum Gases
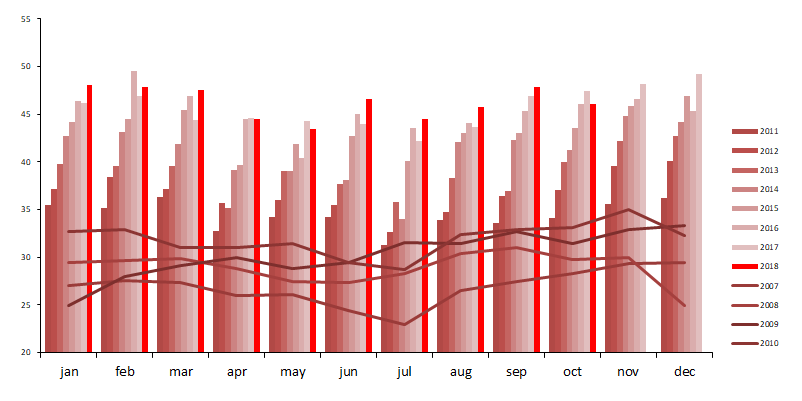
LPG production reached 17 million tons in 2018. It grew by just 0.8% in 2017 despite growth in gas production. LPG production grew 4.3% in 2016 as increased condensate production offset declines at refineries.
LPG production in Russia in 2015 was up 6% from 2014 amid slightly declining refining throughput volumes.
Production of LPG in Russia grew by 5% in 2014 – the growth was below 6% growth in 2013. The growth was supported by increased utilization of petroleum gas, growth in condensate production, and gains in refinery throughput.
Figure. LPG production in Russia in January 2007 – October 2018 (thousand tons a day in a month)
Development drilling footage
Total footage in Russia grew to over 26 million meters in 2016. Development drilling footage accounted for 95% of the total. Development drilling footage was up over 15% in 7 months of 2016 to the same period in 2015. The growth slowed down in the last month of 2016 bringing the annual average growth to 9%.
Development drilling footage was up by around 10% in 2015 in spite of falling crude oil prices. Ruble devaluation made upstream investment cheaper for oil companies, but potential gains were likely to be offset by liquidity / CAPEX financing problems in 2016. Rosneft and Tatneft increased drilling while other major players reduced or maintained activity levels in 2015.
Political decisions and targets on crude production levels will define drilling activity levels in 2016 – daily development drilling was up 15% in the first five months of 2016 to the same period in 2015.
Development drilling footage was down 6% in 2014. Reduced drilling footage was related to the decline in activity by Surgutneftegas and Rosneft in KhMAD (West Siberian region) – key producing region in Russia. Development footage decline was compensated by growth in horizontal drilling footage share (included in the total activity below)
Figure. Development drilling in January 2013 – December 2016
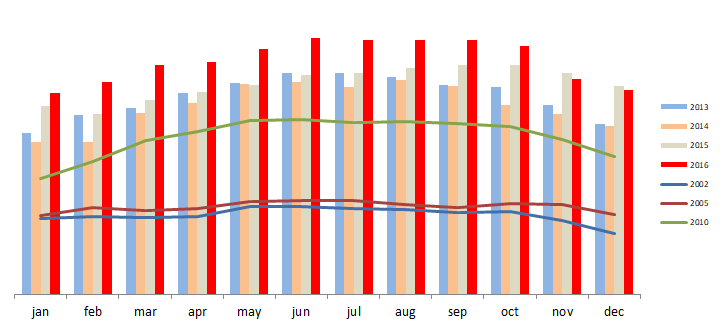
Correlation between Brent and development drilling activity was high in 2002-2015 (0.74), but this was mostly a coincidence as drilling in Russia was in an upward trend since 2005. Sharp crude price declines of 2009 and 2015 did little to reduce activity levels. The widening gap between price and activity was most evident in late 2015 early 2016.